Small Business Evaluation Tool
Helping Small Businesses Grow Smarter: Tier-Based Assessment and Actionable To-Do Lists
Helping Small Businesses Grow Smarter: Tier-Based Assessment and Actionable To-Do Lists
Economic Development teams seek to understand where small businesses are in their growth journey to provide more relevant and effective support services. This tool allows us to deliver more relevant and effective support services to over 7,000+ small businesses across the city.
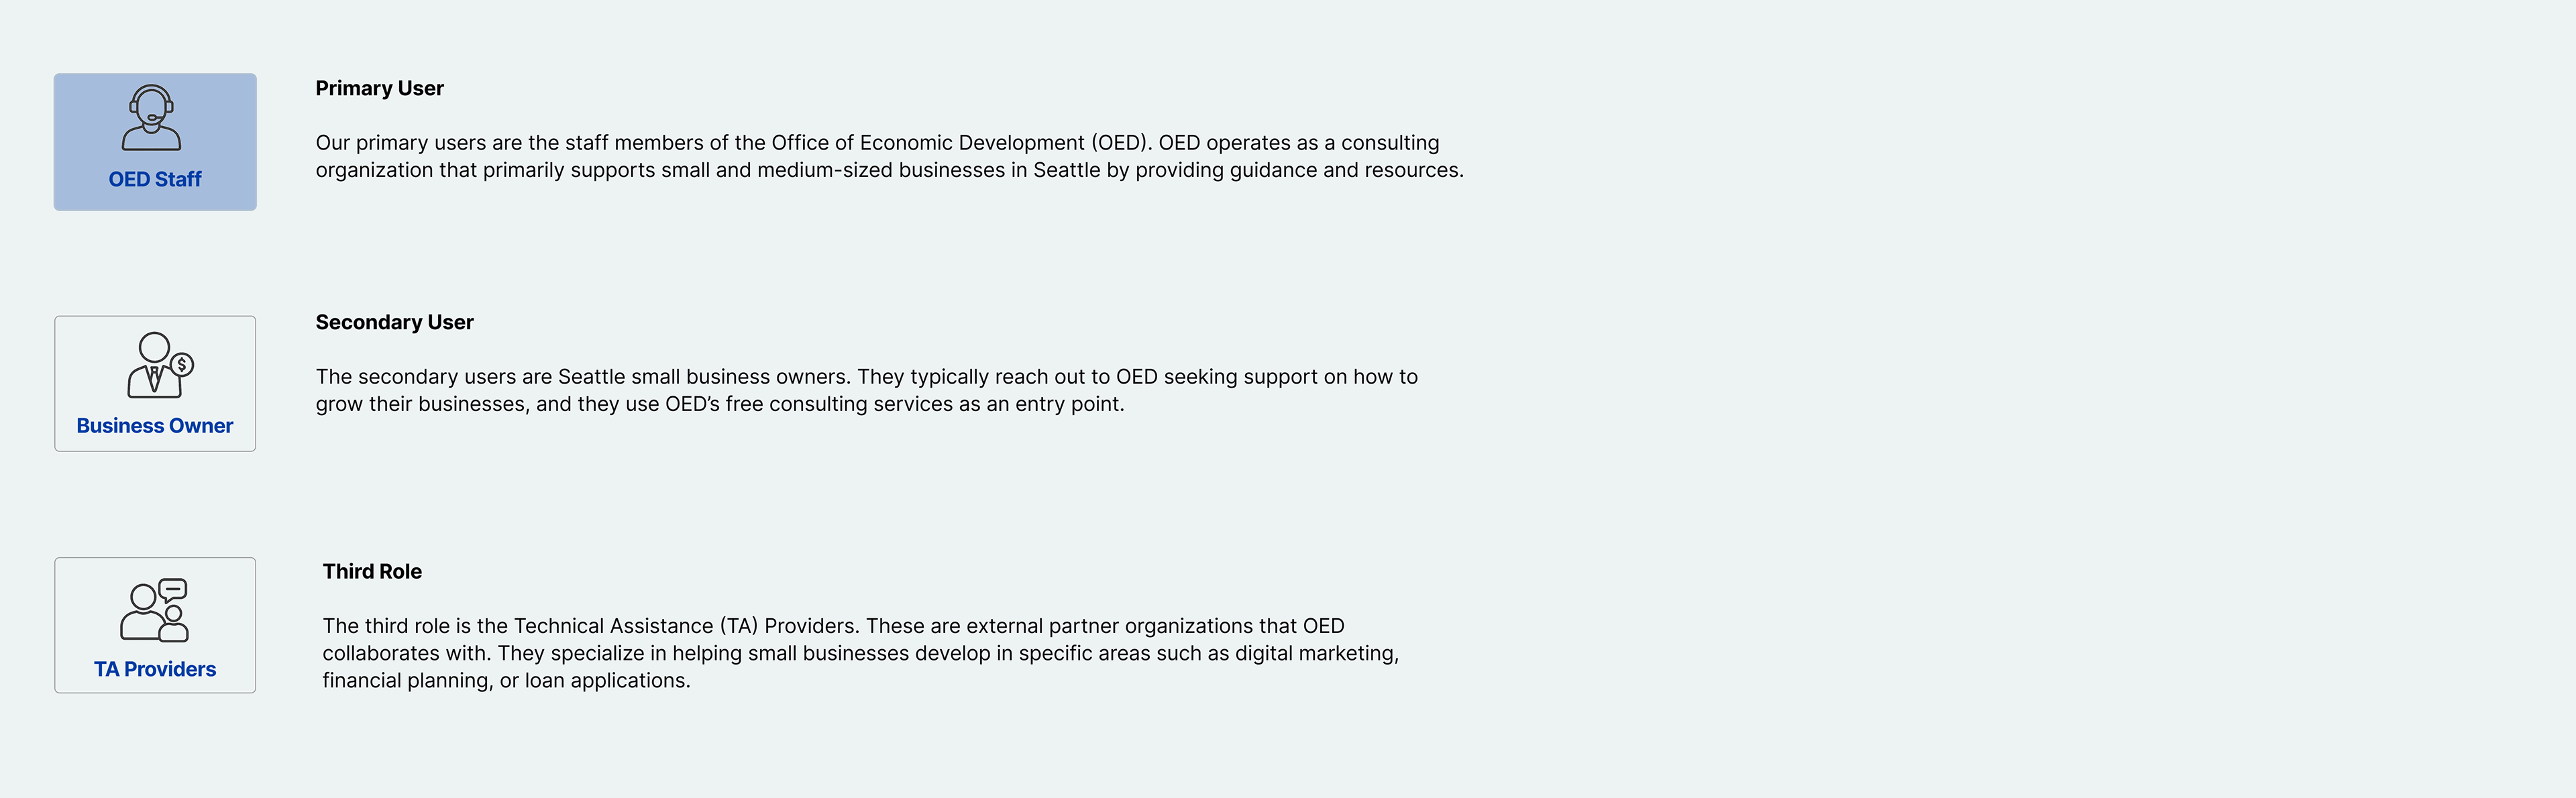
As the Service Designer on the Office of Economic Development (OED) team, I led the design of a service package to improve the small business referral process. Our solution enables OED to deliver more tailored support by streamlining the business referral process. The final deliverables were built using Microsoft products.
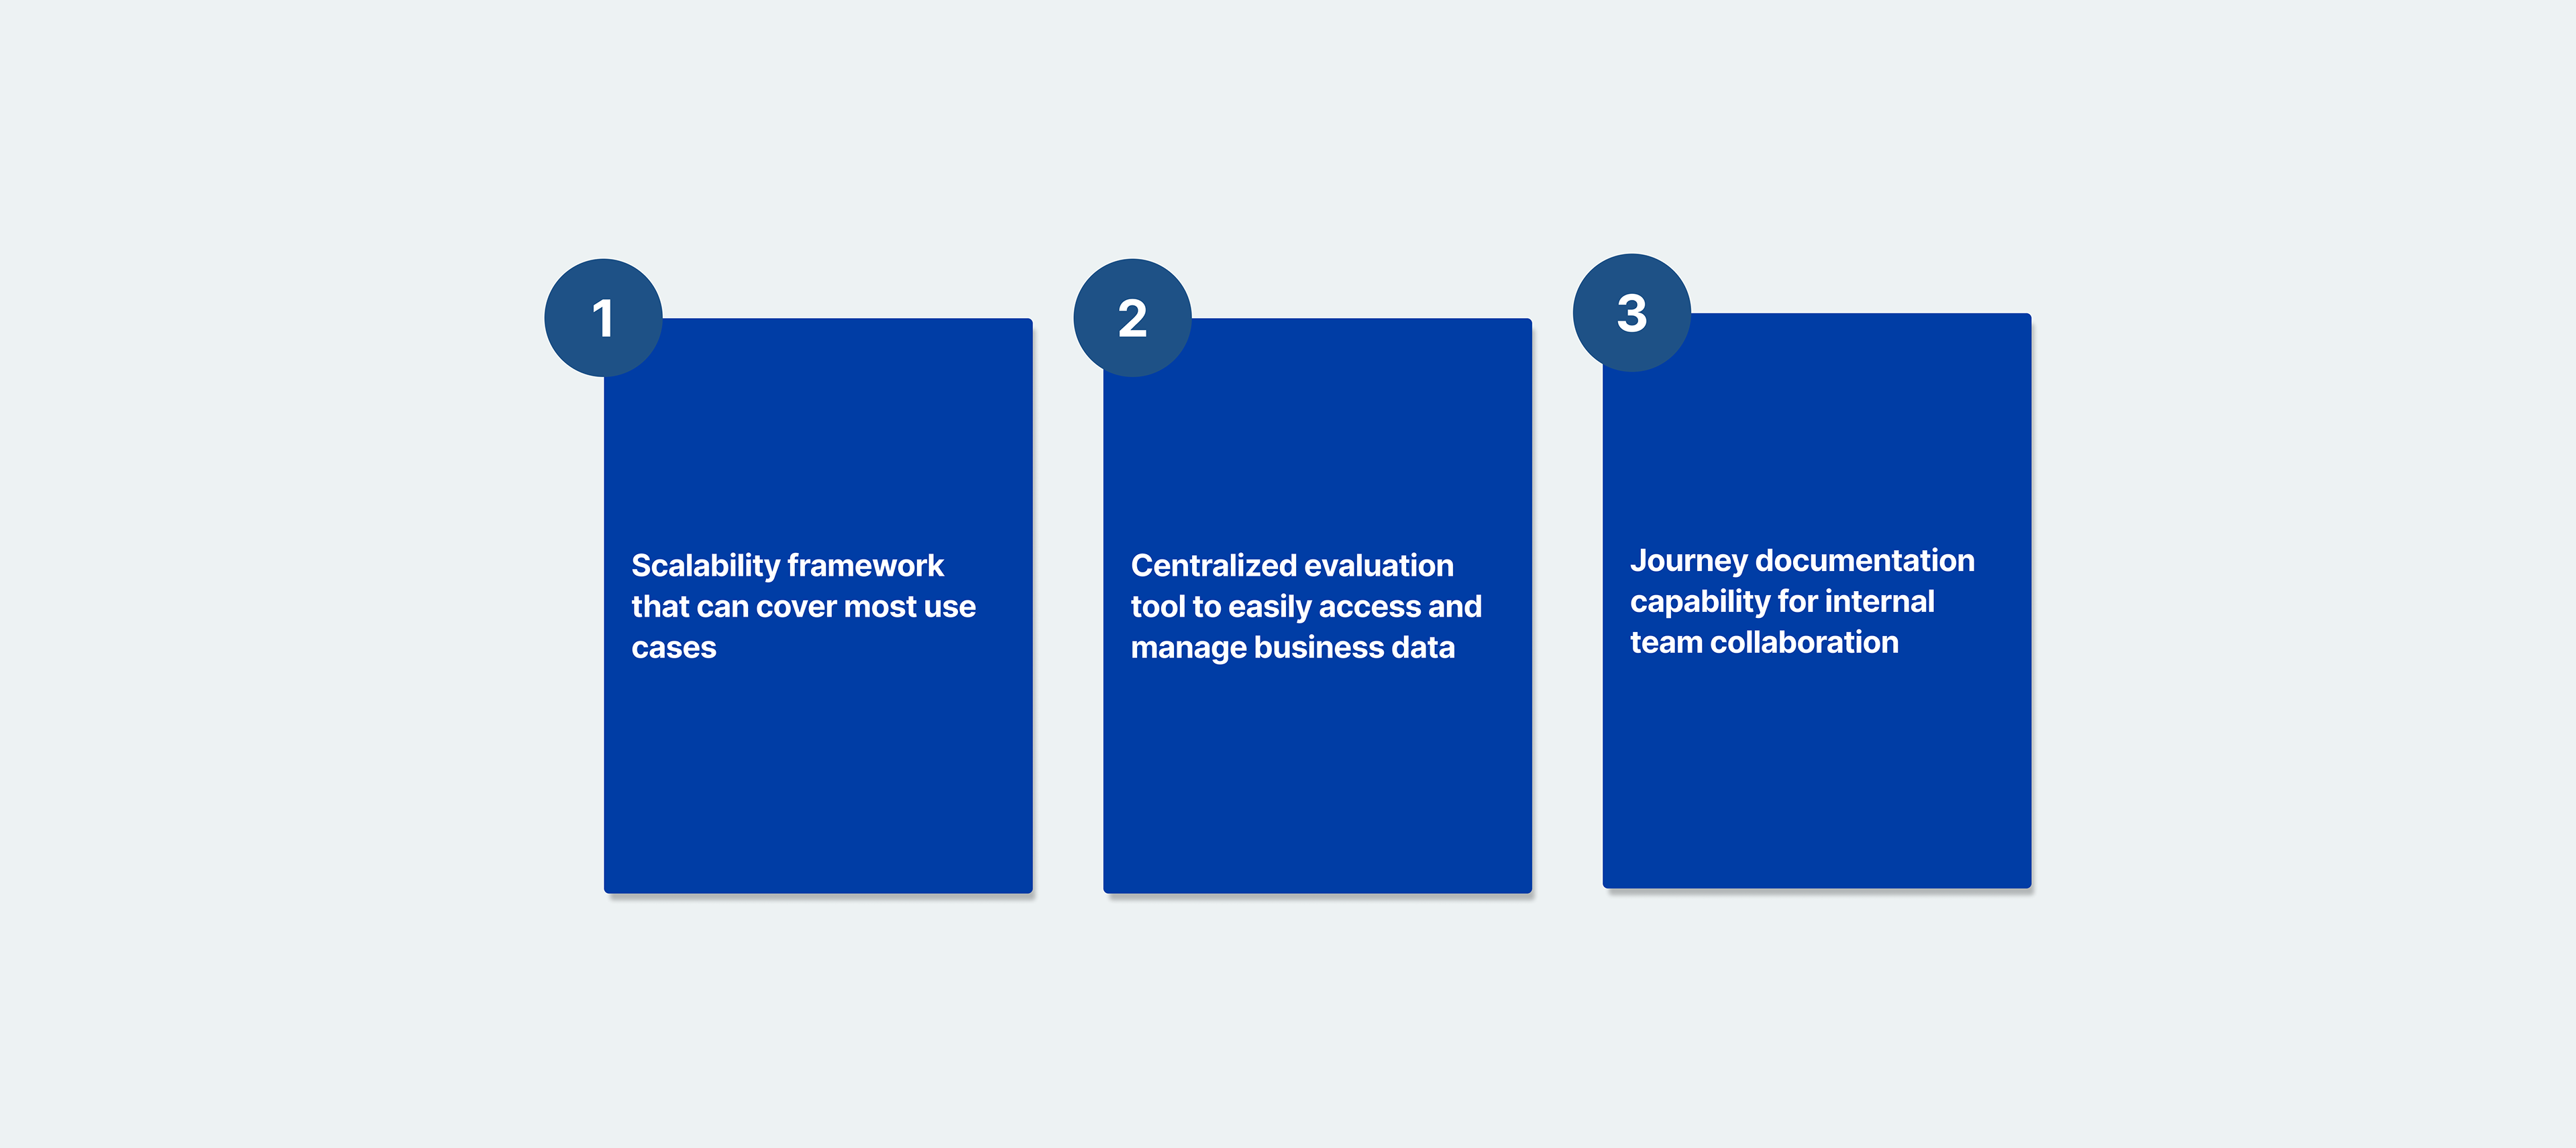
What we need to solved?
1. Scalability framework that can cover most use cases
2. Centralized evaluation tool to easily access business data
3. Journey documentation capability for internal team collaboration
TIMELINE
SEP 2024 - Current
SCOPE
B2B Tool, Information Architecture, User Research, Survey Design
DELIVERABLES
SaaS Internal Evaluation Tool
ROLE
Service Designer
TEAM
Domonique Meeks/ Program Manager
Eduardo Rojas/ Small Business Advocate
Ruolin Chen/ Project Manager
Kevin Wen/ UX Designer
Kelvin Law/ Data Analyst
IMPACT
The platform will launch at the end of 2025. It has already received
feedbacks from business and internal users during 15+ trial tests,
with 92% reporting improved efficiency in their daily operations.
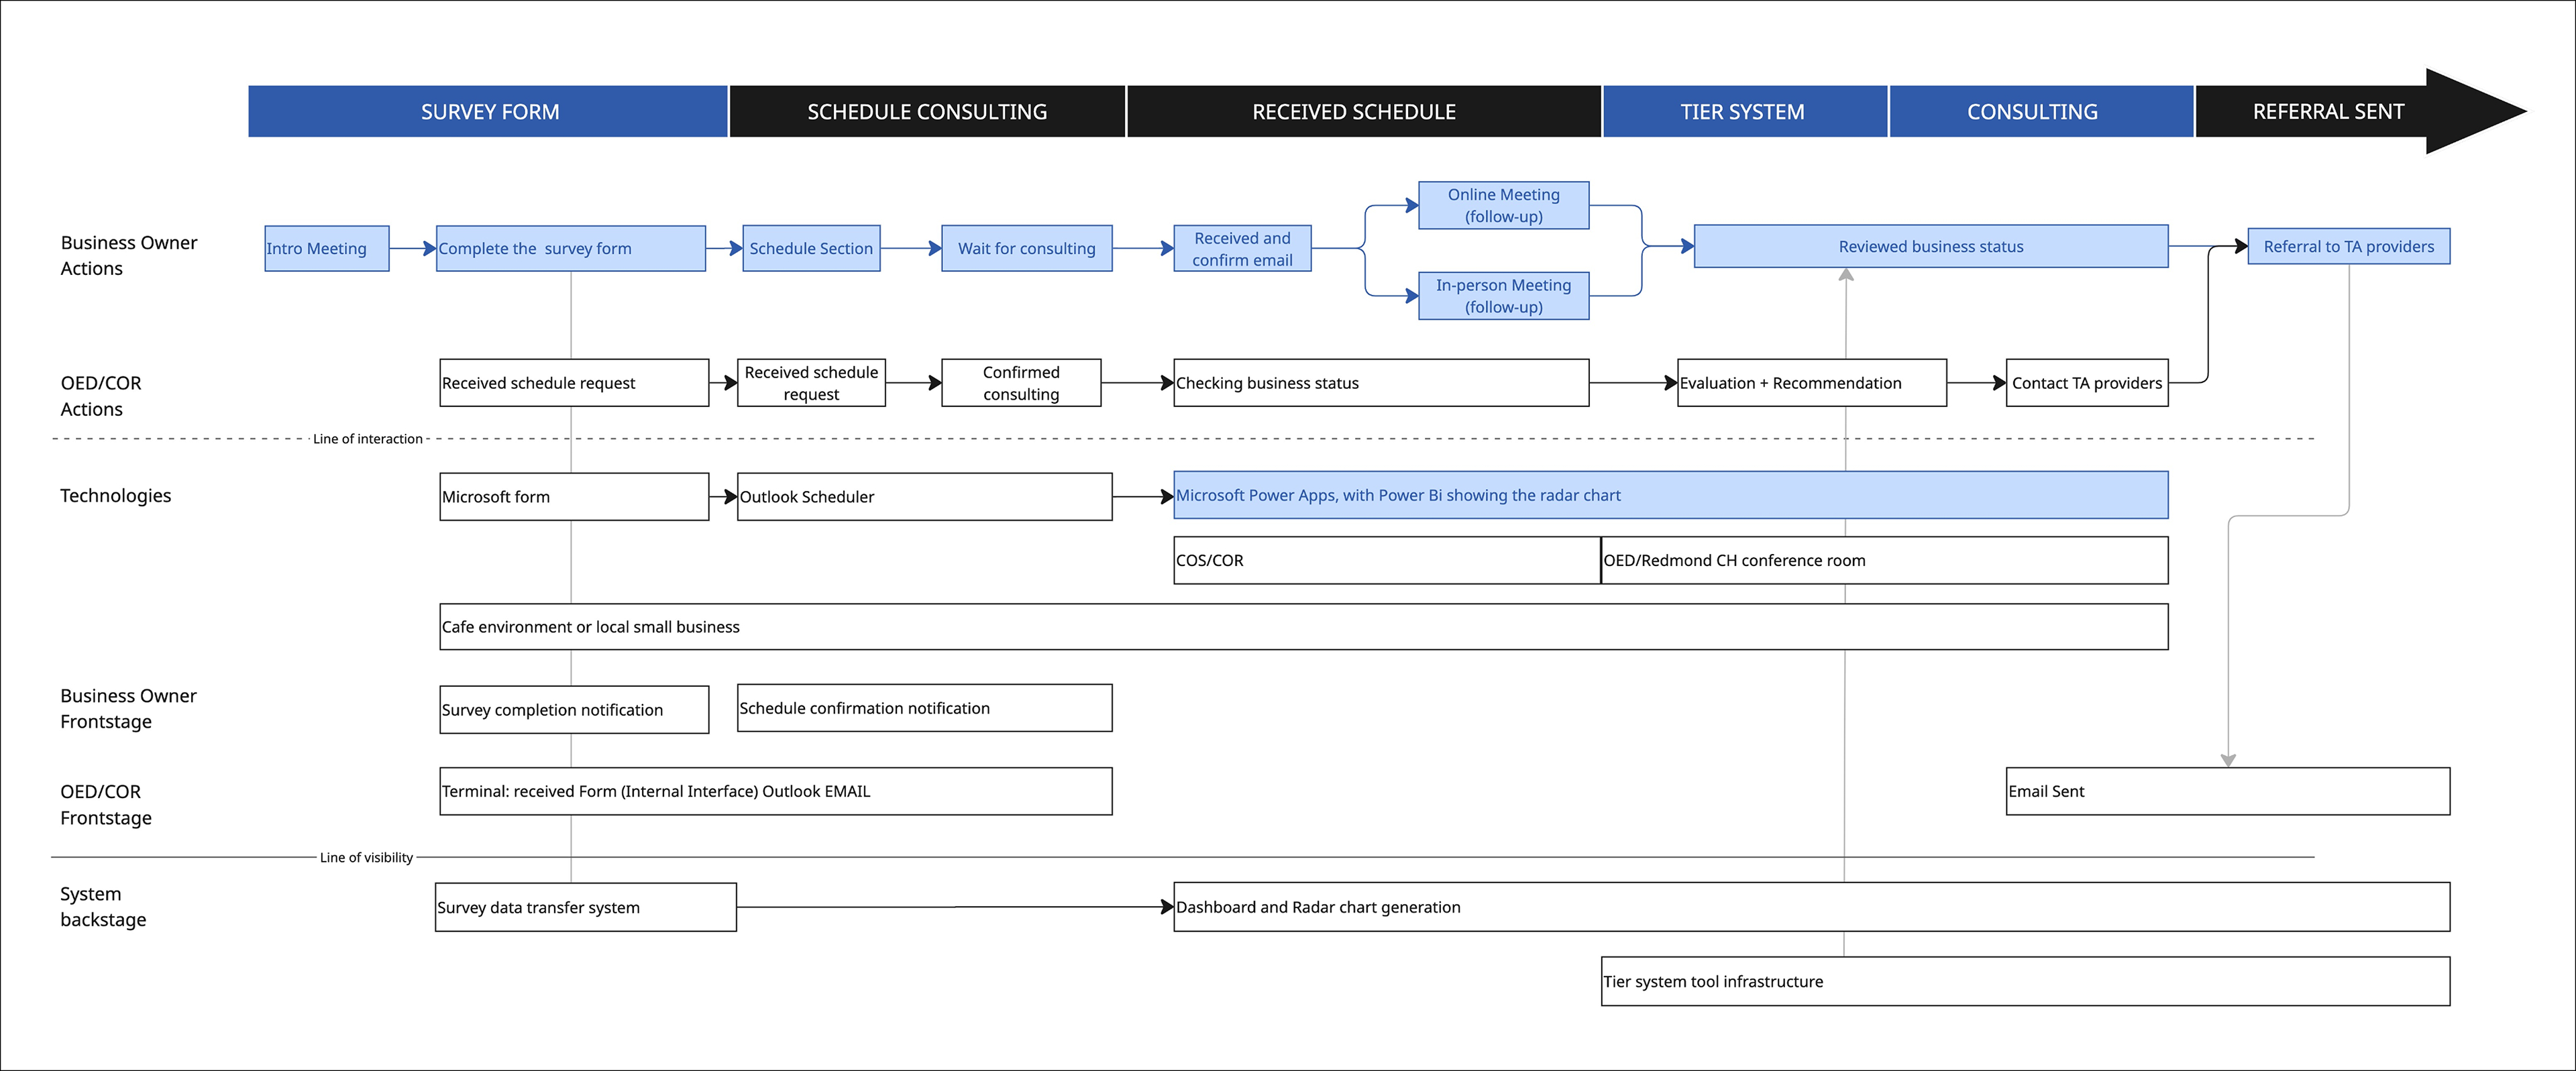
Final Design
Service Blueprints - user touchpoint
Before diving into the problem statement, I want to explain the user journey.
Problem Space
OED staff spend significant time manually tracking and consolidating data from over 7,000 small businesses, without a centralized system. This inefficiency makes it difficult to deliver timely, personalized support to business owners.
Solution Overview
We created a scalable framework that addresses the majority of business needs while leaving room for future growth. A centralized dashboard was introduced to make cross-department collaboration more seamless, and tracking features were added to capture follow-ups and key milestones. Together, these improvements not only streamlined OED’s consulting process but also reduced overall referral time by 35% and increased accuracy by 30%, delivering greater efficiency and value to both staff and small business owners.
Design Process
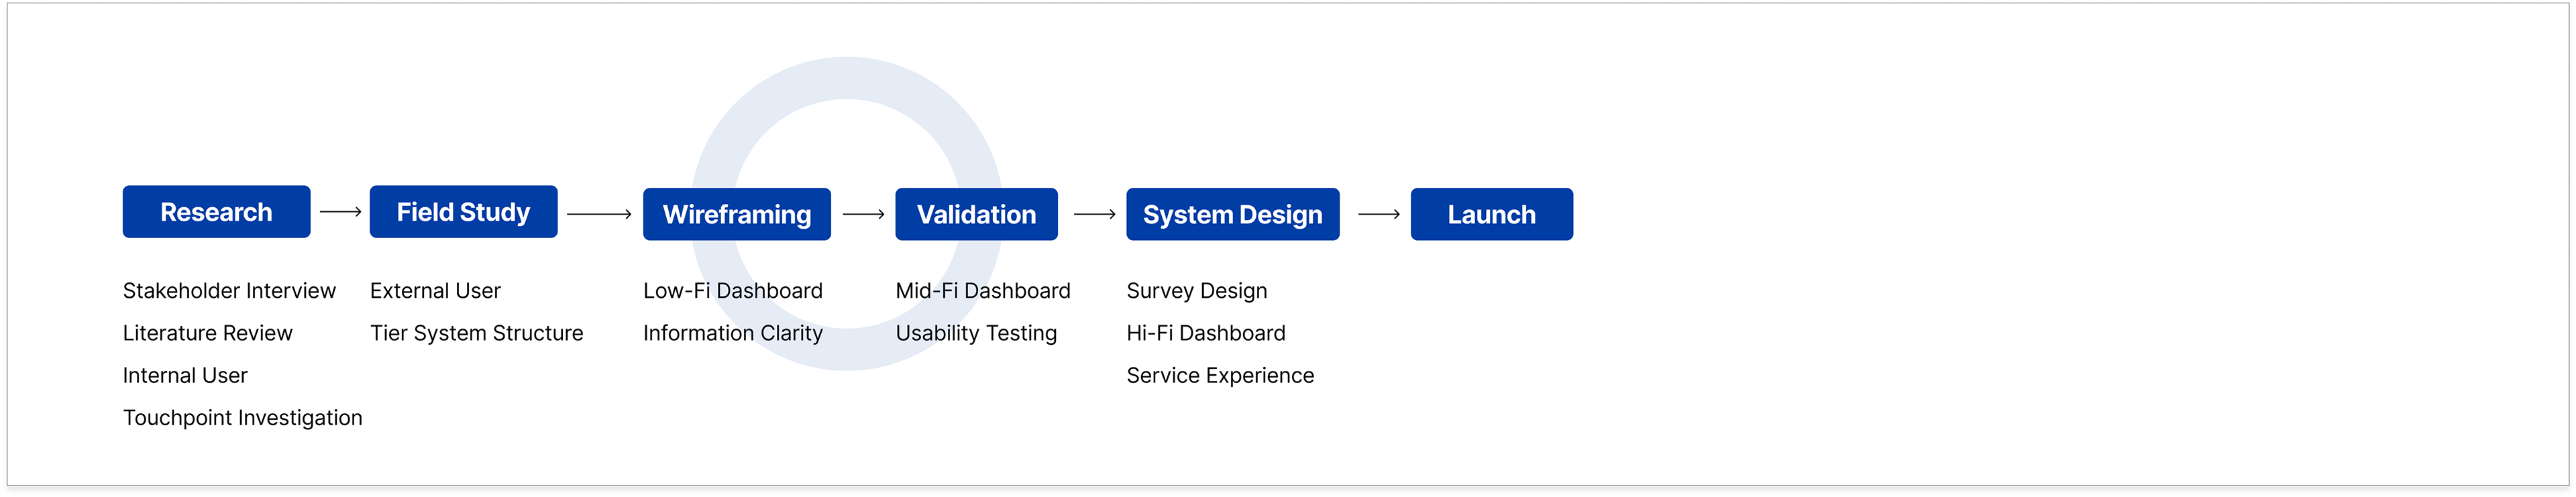
Research (OED Staff Interviews & Requirement Review)
76% of the businesses are restaurants, food trucks, or otherwise food-related.
1. OED staff need a way to quickly summarize business data and easily identify which areas a business is performing well in, and where improvements are needed. This makes clear and intuitive visualizations especially important.
2. They want to provide personalized action plans based on each business’s unique health condition, using structured frameworks tailored to different stages of growth.
- Users need to see a summary view of each business
- Users need to access a clear action plan
- Users need to understand the business health level
Research (Field Study: Business Owner Interview)
Research Insight:
- Although business owners are not the primary users of this internal tool, they still interact with it by providing input data
- Most business owners are looking for targeted, actionable next steps, not generic advice.
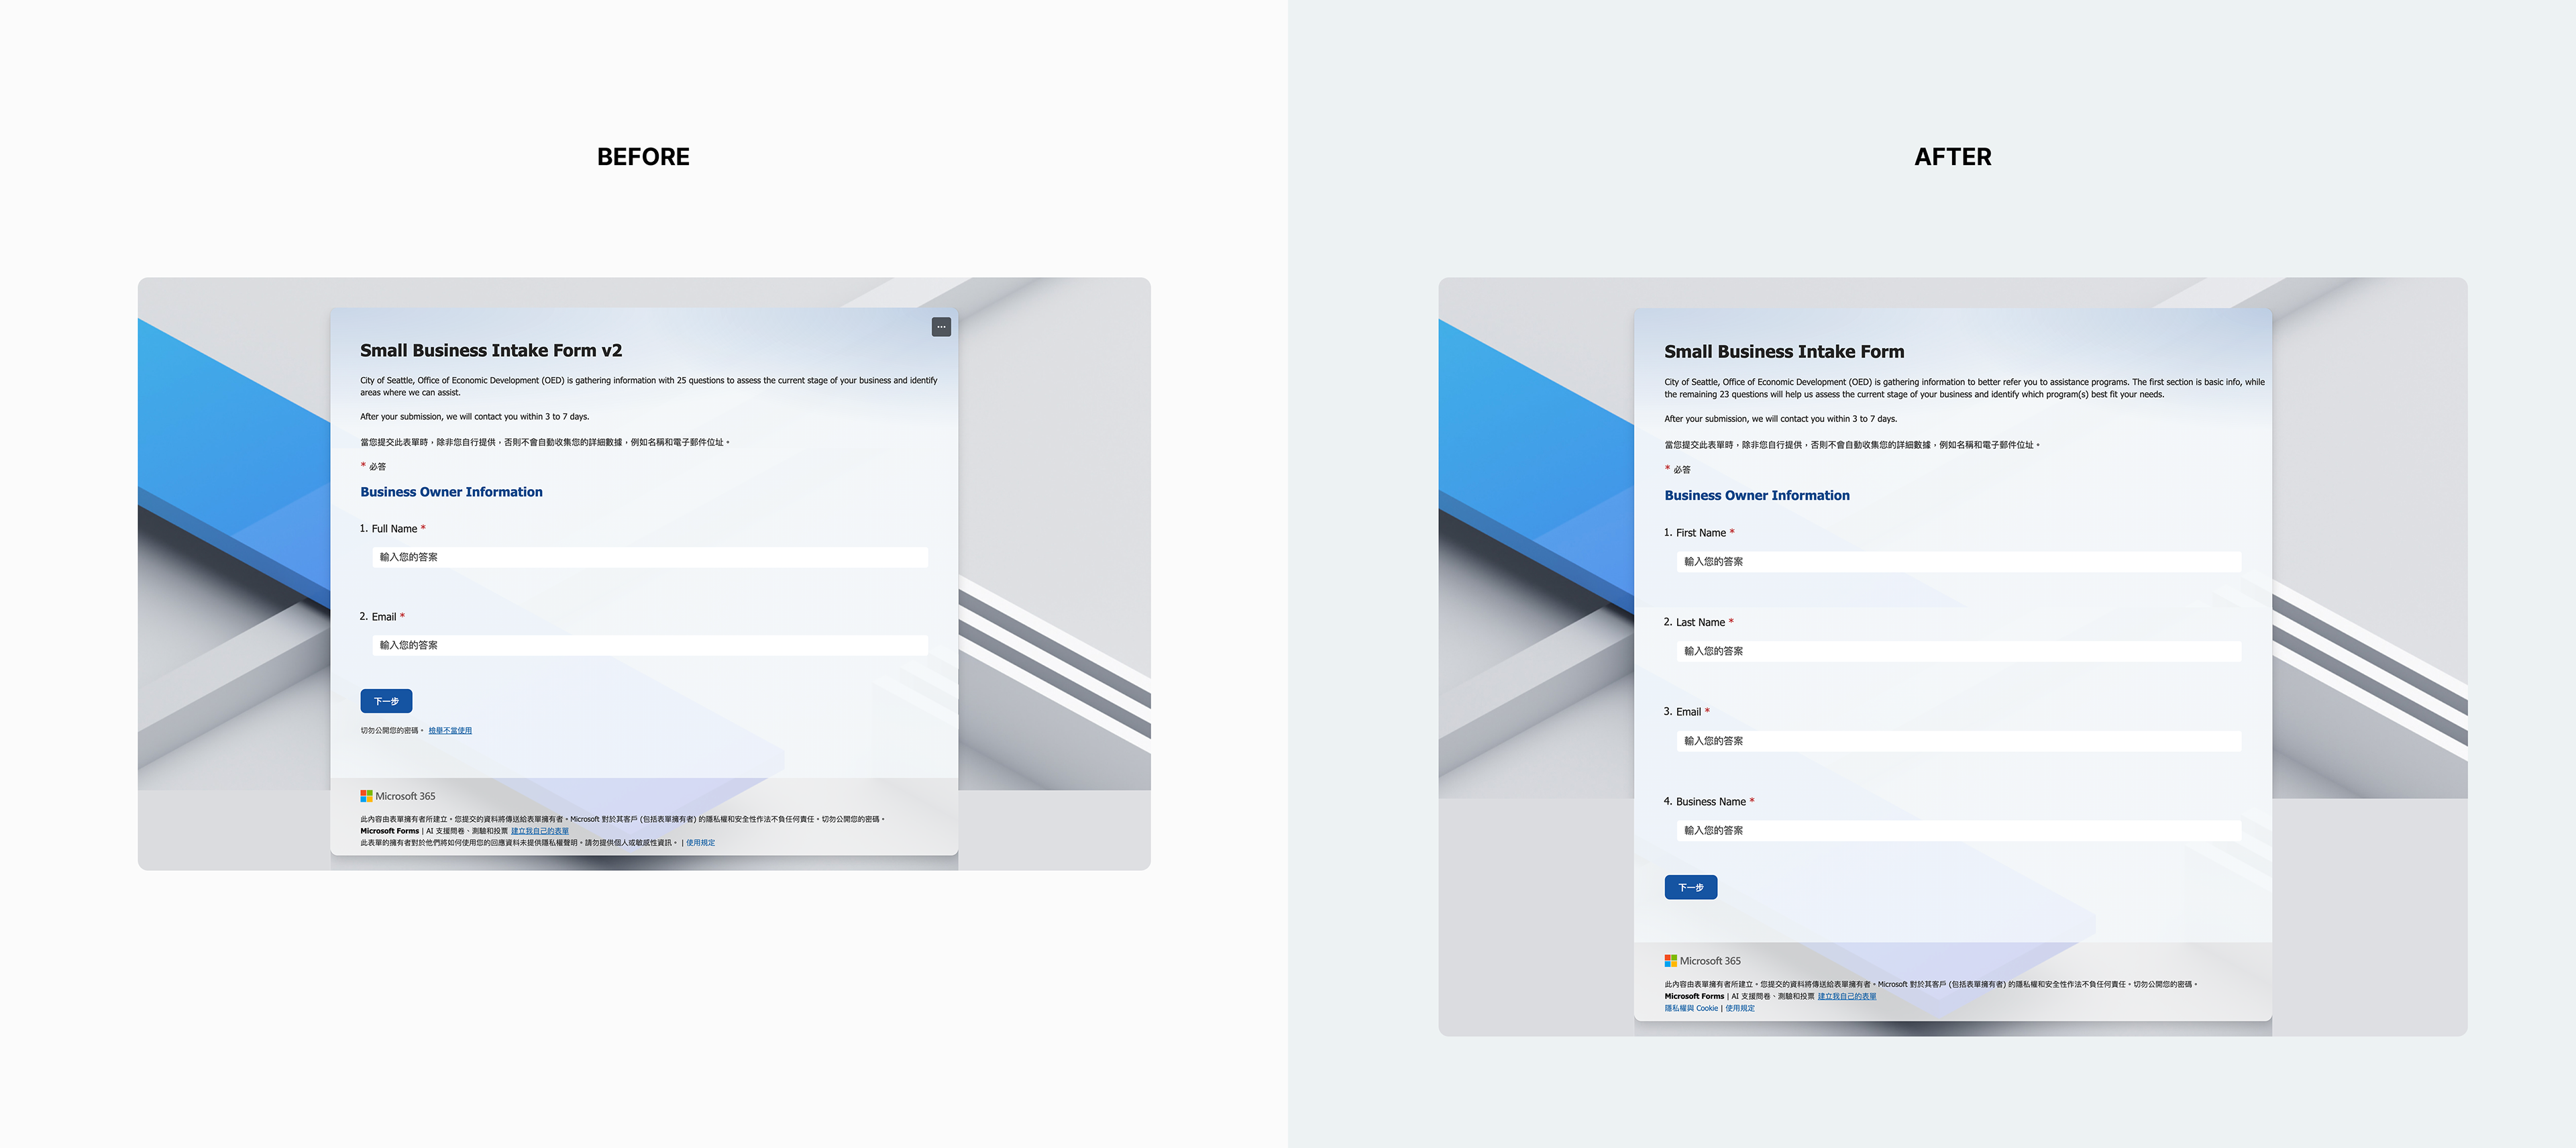
After the interview, I conducted a system design workshop with the PM and several OED staff members, and we decided to implement an intake form as the main input method.
High-Level Design Challenge
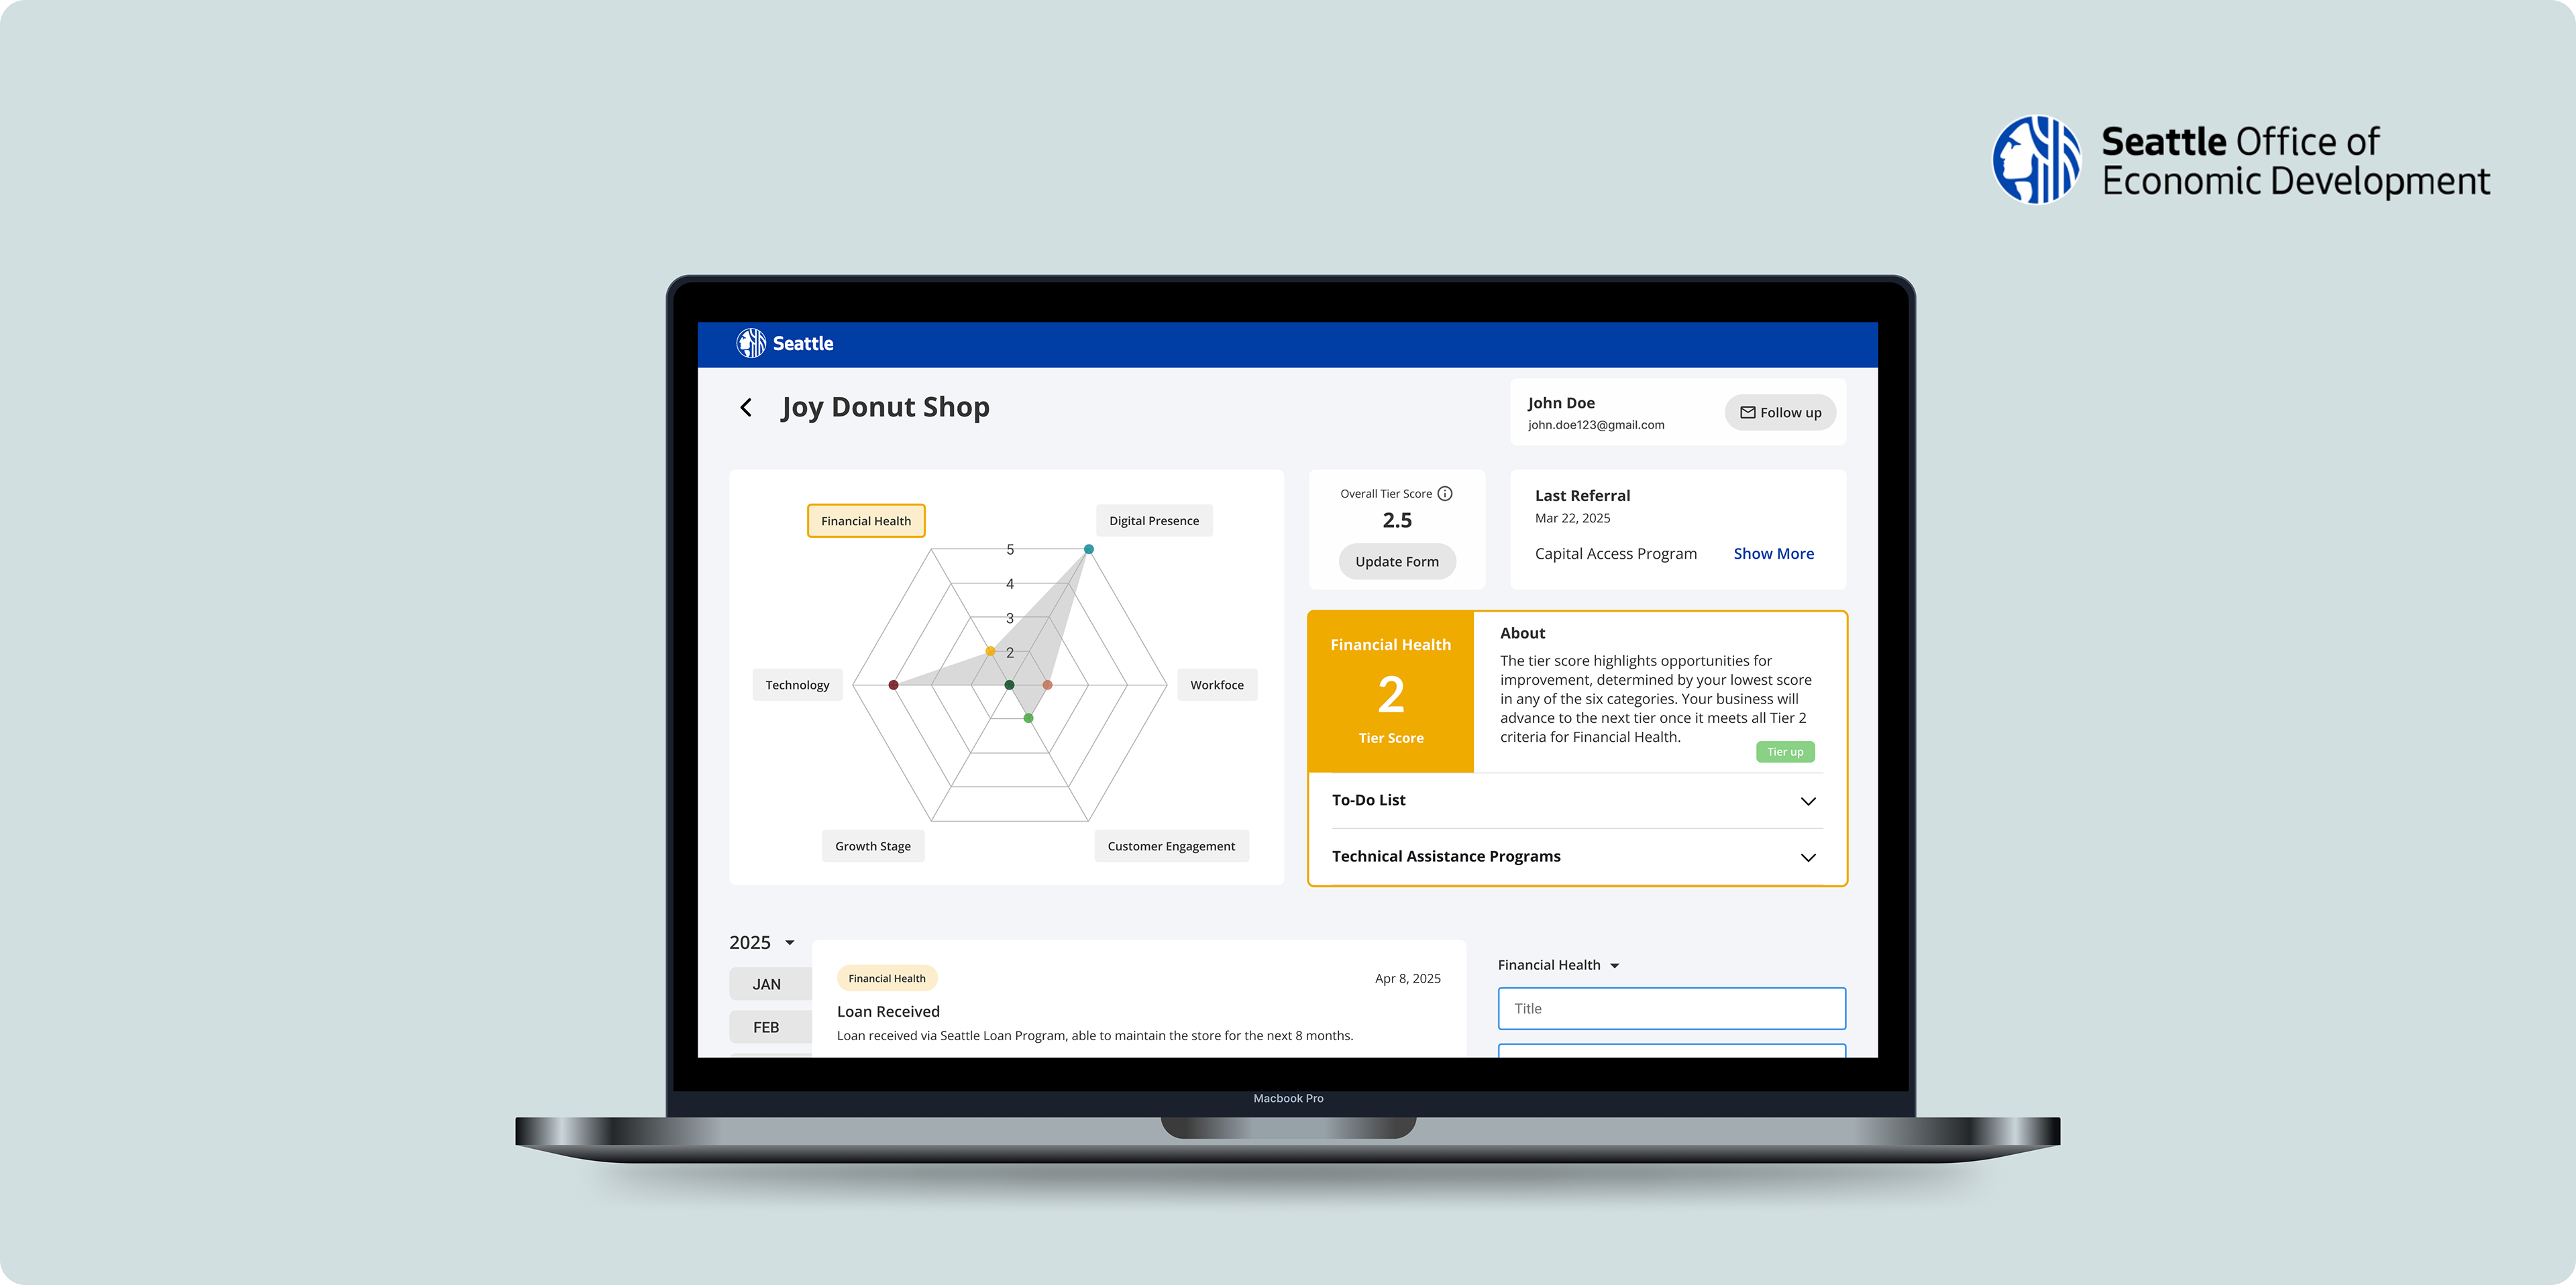
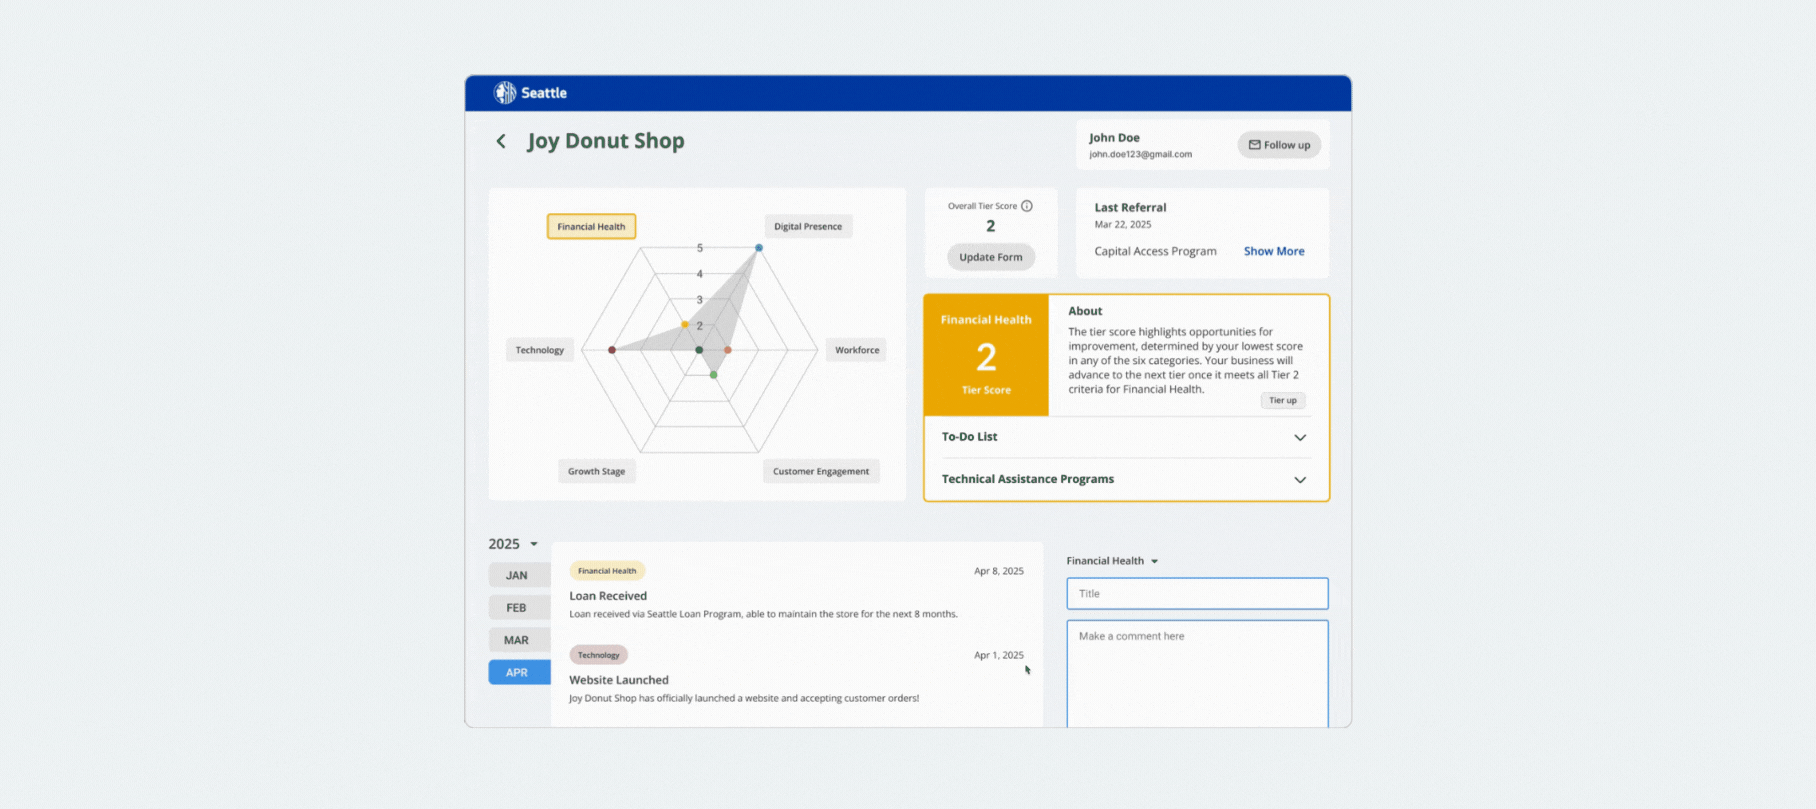
The key challenge was how to summarize the input data effectively within a centralized dashboard. From the interviews and requirement reviews, I found that OED staff needed a simple and clear visual interface to quickly understand the overall status of each business.
This interface had to be organized by clear categories, such as financial health, digital presence, workforce...etc, so staff could easily identify strengths and areas needing support. However, the deeper challenge lay in the consulting-based nature of OED’s services. The system could not only display data but also function as a collaboration tool. This meant the dashboard needed to go beyond “viewing” information; it also had to support “recording.” By incorporating journal capabilities, staff could document key discussion points and follow-up actions after each consultation, making the tool both informative and actionable.
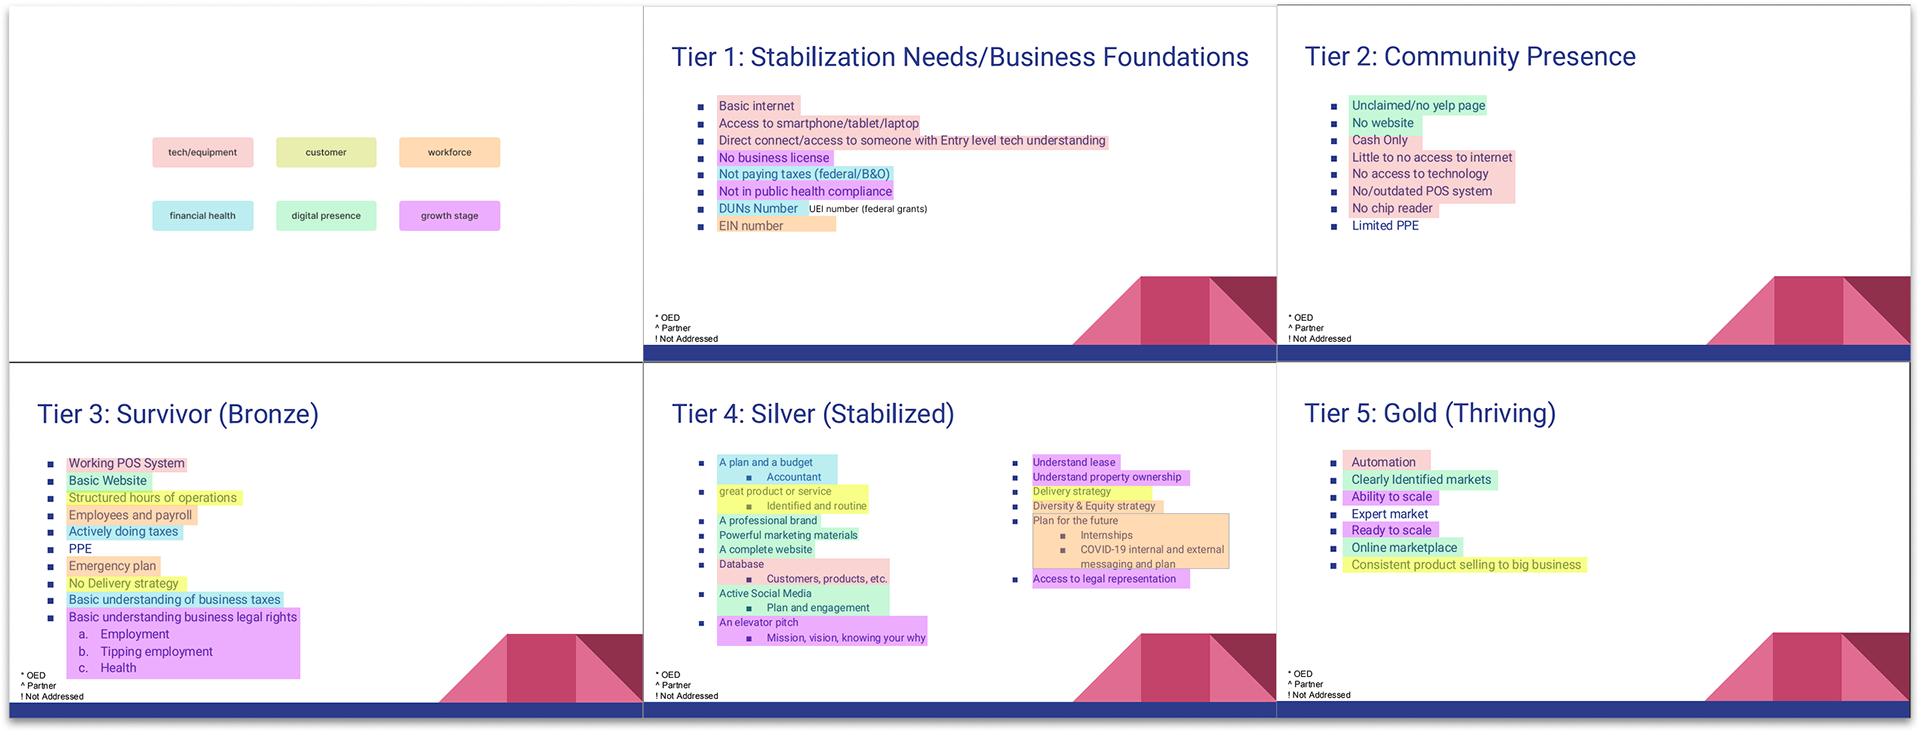
Build the tiered evaluation system
The key challenge was how to summarize the input data effectively within a centralized dashboard. From the interviews and requirement reviews, I found that OED staff needed a simple and clear visual interface to quickly understand the overall status of each business.
1. Card Sorting Workshops – Conducted sessions with OED staff to group business challenges and milestones into logical categories.
2. Stakeholder Workshops – Facilitated collaborative discussions to align on what progression should look like across different business maturity levels.
3. Iterative Refinement – Consolidated overlapping ideas and reorganized categories based on staff feedback until six clear tiers emerged
4. Validation with OED Staff – Tested the framework in follow-up workshops to ensure it reflected real-world business conditions
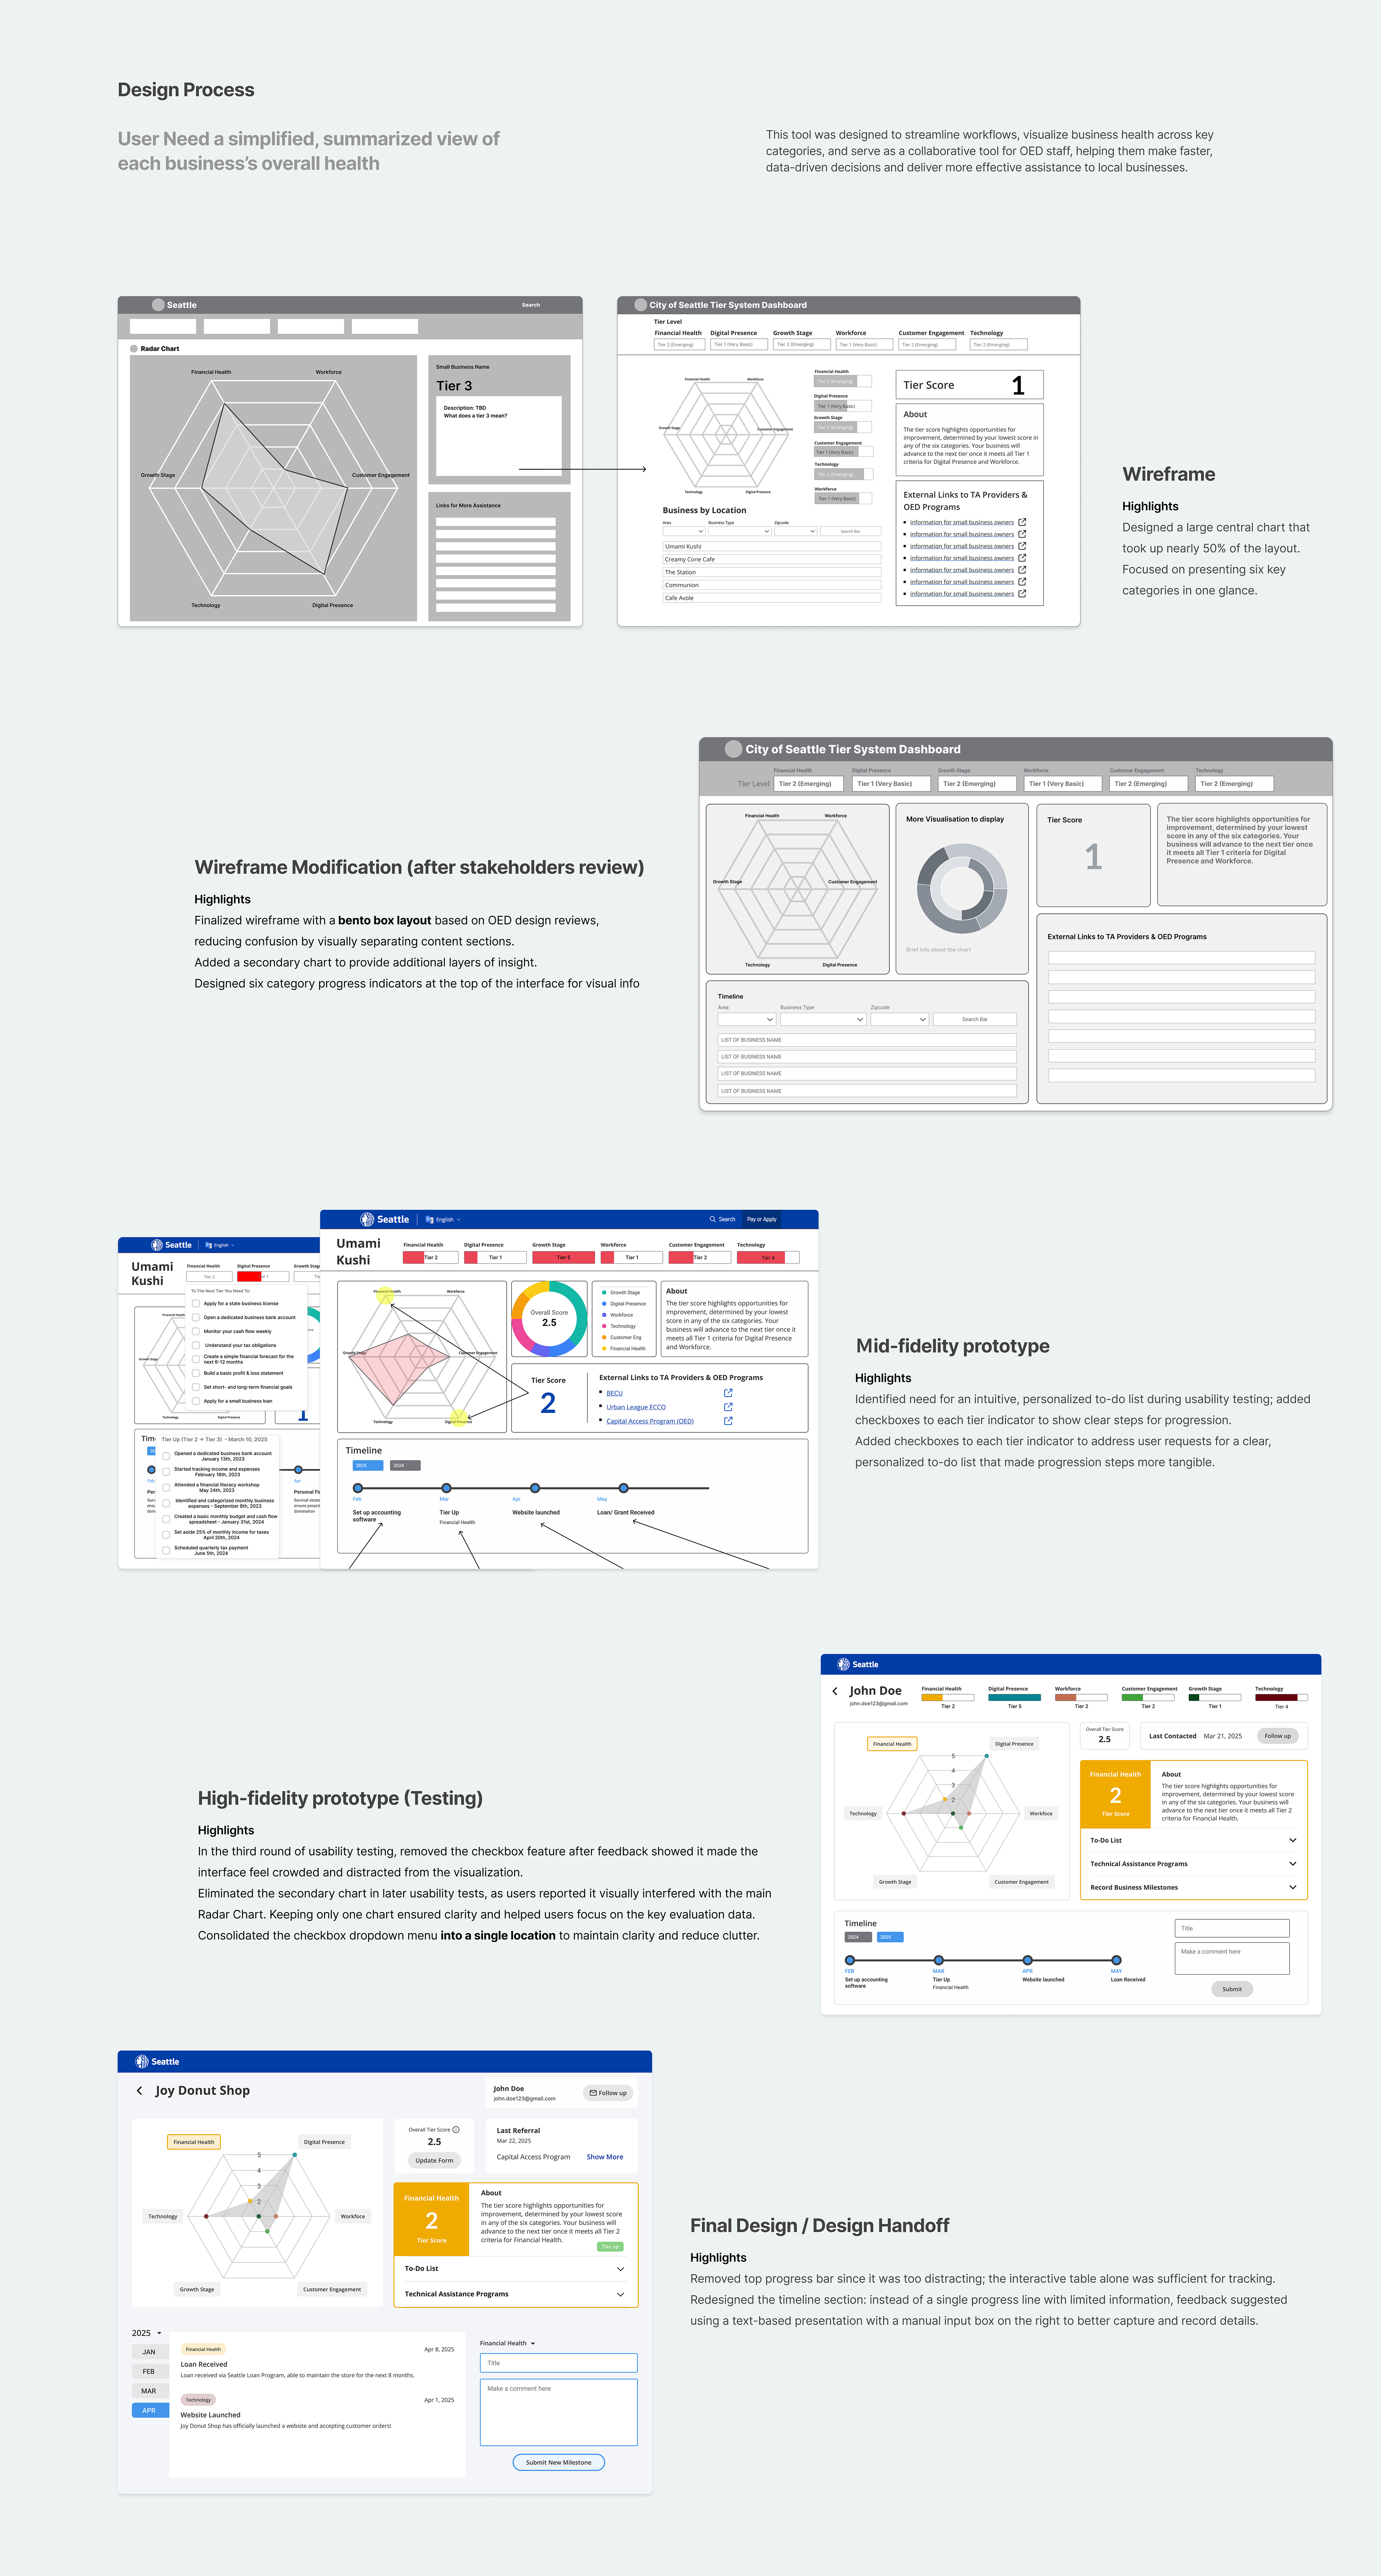
Why Radar Chart?
During usability testing with 15 OED staff members, participants consistently described the radar chart as clear and intuitive. Although we tested alternatives such as bar and line charts, staff strongly preferred the radar visualization because it allowed them to see all six business categories in one place, making it easier to compare strengths and weaknesses without switching between multiple views.
The radar layout helped staff identify priority areas 40% faster compared to the previous tabular format, but also aligned naturally with the tier-based evaluation framework. By mapping categories to the tier logic, the visualization reinforced understanding and made it easier to communicate business readiness levels.
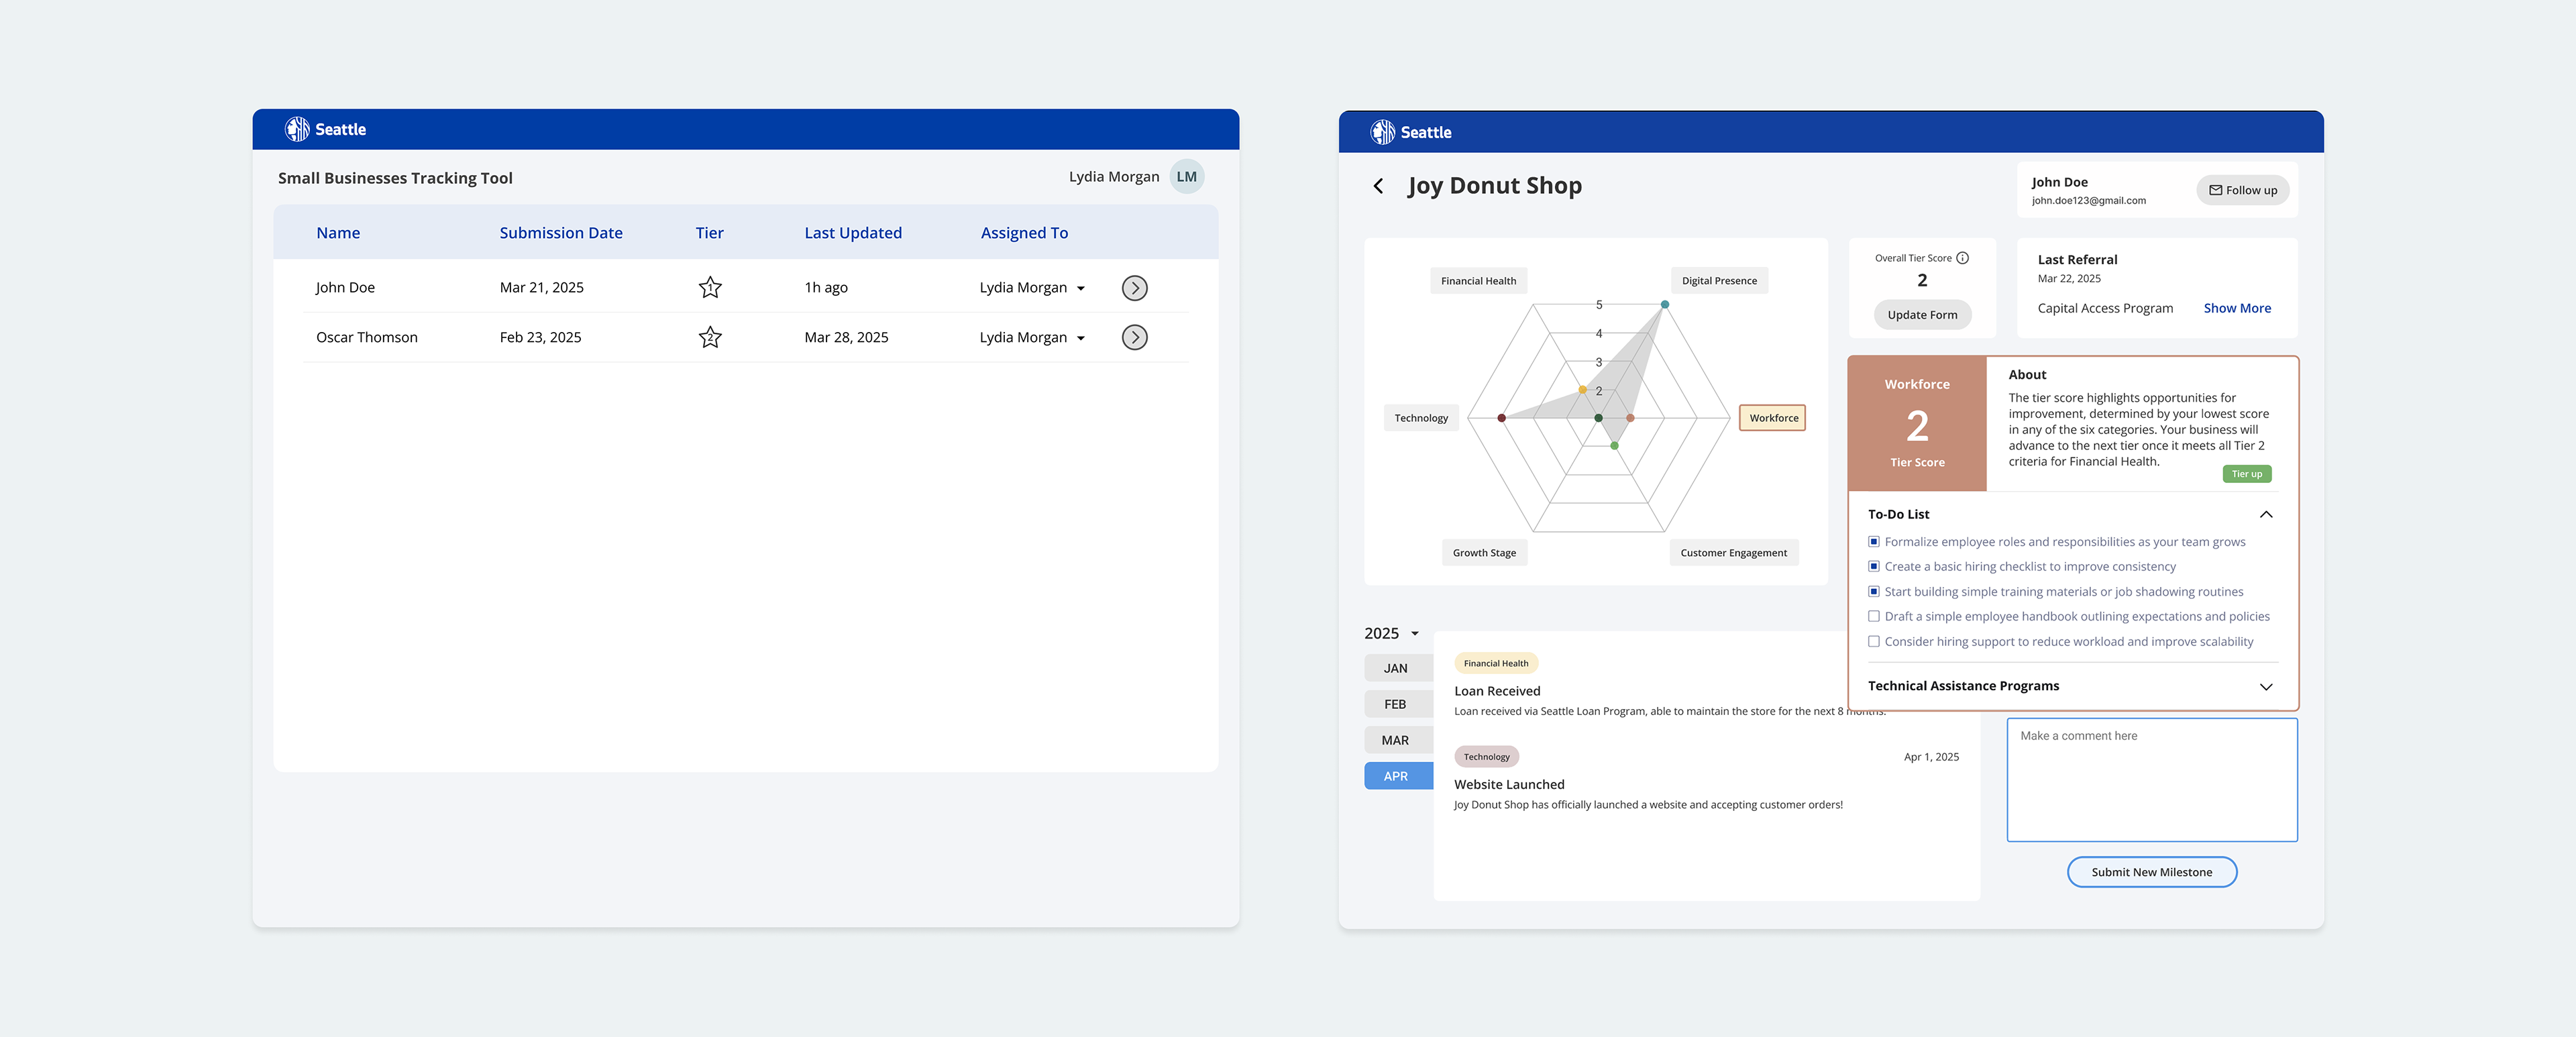
From Evaluation to Action
In usability sessions, OED staff often mentioned the difficulty of switching between businesses when using spreadsheets or siloed notes. By centralizing business lookup in one place, the dashboard supports faster navigation and minimizes context switching.
On the right, the checkbox-based to-do list was used to bridge the gap between evaluation and action. Staff shared that while charts were helpful for identifying gaps, they needed a simple, actionable way to record next steps all in one place. The checklist ensures progress is transparent, consistent across categories, and easy to track over time, turning evaluation into a clear path for support.
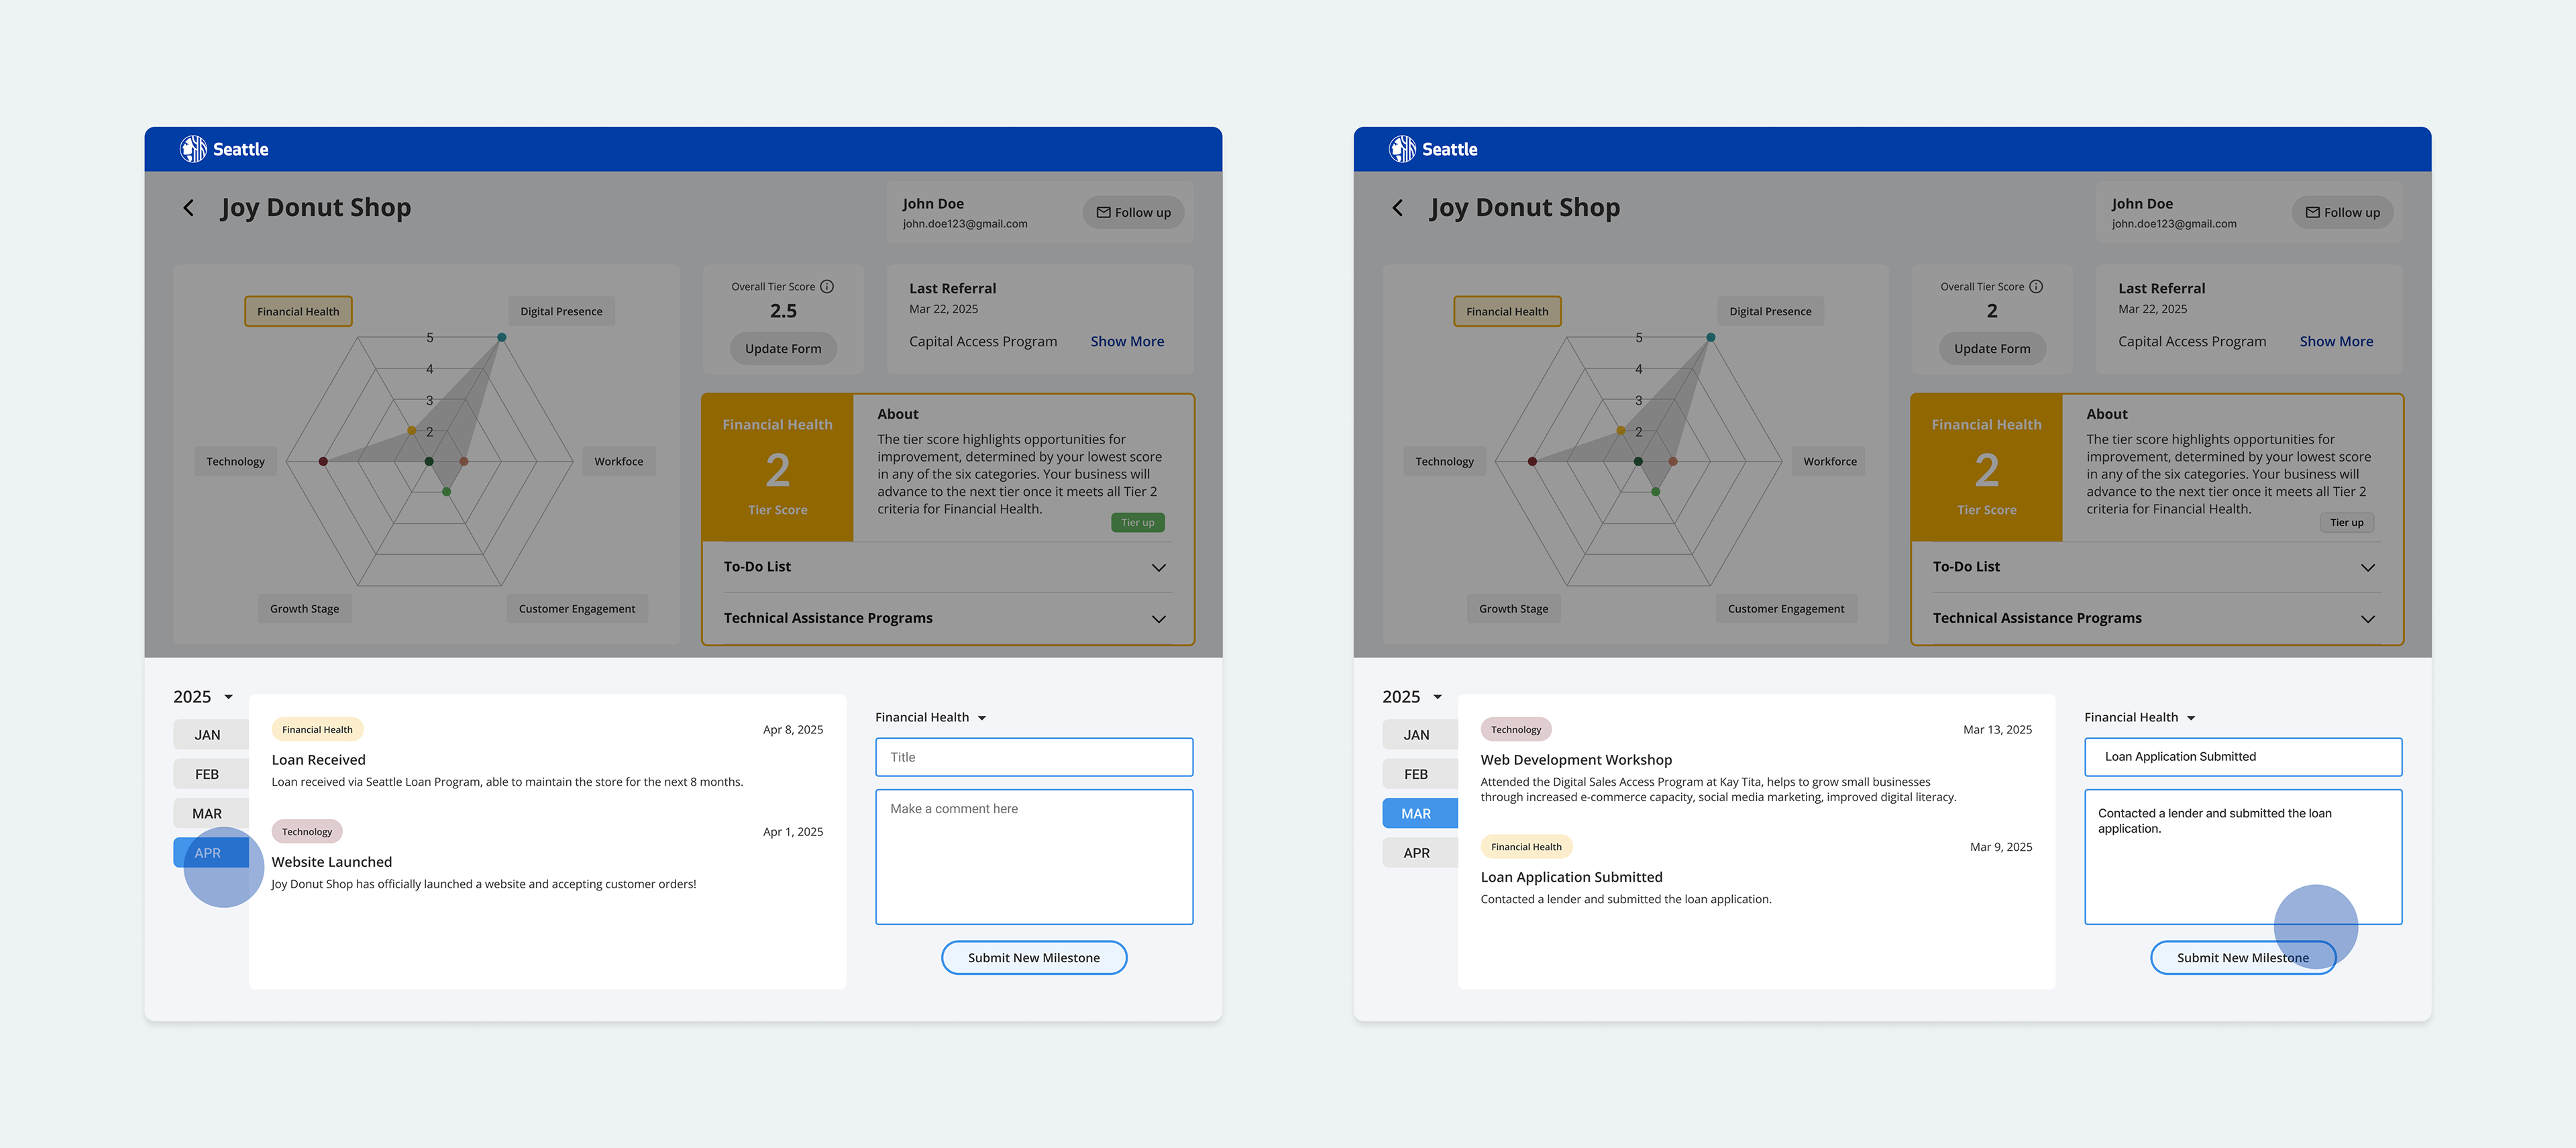
Journal Capability
The nature of OED’s services is consulting-based, which means the system also needs to function as a centralized collaboration tool. To meet this need, I added a journal capability at the bottom of the dashboard, allowing staff to log meeting notes, follow-up tasks, and business milestones directly in the system.
During usability testing with 12 OED staff members, 85% said the centralized journal feature made it easier to prepare for consultations. On average, staff reduced time spent searching through external spreadsheets by 44%, and reported an increase in confidence that no important client detail would be overlooked.
Result & Impact
The new dashboard framework streamlined OED’s evaluation process by introducing a scalable structure that supports 80% of use cases, a centralized dashboard for seamless team collaboration, and journal capabilities for follow-ups and milestone tracking. These solutions collectively reduced OED’s referral process time by 35% and improved data accuracy by 30%, while also reinforcing visual clarity and simplifying complex workflows for staff.
Next Step
Although the dashboard significantly reduced referral time and improved accuracy, the current framework is still limited to food-related businesses. This highlighted the need for broader scalability to support Seattle’s diverse small business ecosystem. The result also revealed opportunities to enhance predictive insights, automate referrals, and strengthen cross-department collaboration, which can guide future iterations of the tool.